Introduction
The electrocardiogram (ECG) provides valuable bedside information and is used in conjunction with a detailed history and examination. Its main role is in the diagnosis of arrhythmia, but may also give clues to structural abnormalities of the heart and congenital heart disease. In children the most common reasons for performing an ECG include palpitations and tachycardia, syncope, murmur, suspected congenital heart disease, or family history of arrhythmia.
This article covers the core principles of ECG interpretation. In addition, we discuss the important differences in the ECG in paediatrics, and the underlying reasons for these. This should give the reader confidence in identifying the spectrum of normal ECG patterns, and the skills to diagnose the most commonly seen abnormalities.
ECG basics
The ECG reflects the spreading wave of electrical activity passing through the myocardium during the cardiac cycle. In sinus rhythm, the action potential travels from the sinoatrial (SA) node through the atria (P wave) to the atrioventricular (AV) node. Here the impulse is delayed, allowing synchronous atrial and ventricular contraction, before being rapidly conducted by the bundle of His, right and left bundle branches, and the Purkinje fibres (the QRS complex). The T wave is produced by ventricular repolarisation. Systematic ECG interpretation should examine each of these events in turn [1].
To allow accurate measurement the ECG must be calibrated correctly. Calibration markers are shown before every ECG trace, shown as a 10mm tall rectangle, meaning 10mm equals 1mV. The standard speed for ECG recording is 25mm/s, so that one small square equals 40ms and one large square equals 200ms [2].
Rate
The heart rate is the first important measurement to note on the ECG. The normal heart rate is often higher for children than adults, and decreases with age. A rough knowledge of these normal age-adjusted ranges is important to understand and diagnose tachycardia and bradycardia in children (Figure 1).
| Age | Heart rate |
| 0-11 months | 110-160 |
| 1-2 years | 100-150 |
| 2-5 years | 95-140 |
| 5-11 years | 80-120 |
| 12+ years | 60-90 |
Figure 1: Normal heart rate in children by age [2].
A standard 12-lead ECG is measured over 10 seconds, therefore the number of QRS complexes in the rhythm strip multiplied by 6 is equal to the rate[1]. This can be quickly estimated by the measuring the RR interval:
Rhythm
The heart rhythm may be sinus or non-sinus. Sinus rhythm requires a single P wave to precede every QRS complex, with an equal number of P waves and QRS complexes. Sinus arrhythmia is common in children, and causes an irregular rhythm that changes with the child’s breathing. Every P wave is followed by a QRS complex and therefore this does not indicate disease.
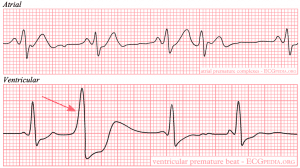
Ectopic beats are non-sinus QRS complexes, and are also common in children. They can be broadly classified into atrial, junctional, or ventricular based on their origin and morphology. Examples are shown below (Figure 2). Their significance depends on their origin, frequency, and persistence.

Figure 2: Ectopic beats by origin. Images obtained under Creative Commons licence 3.0 from CardioNetworks ECGpedia.org.
Cardiac axis
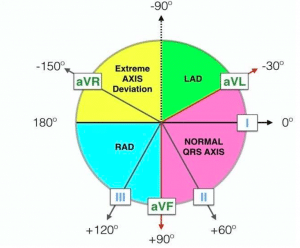
Calculating the cardiac axis requires an understanding of normal electrical conduction through the heart and the relative positions of the limb leads (Figure 3).

Figure 3: Assessment of cardiac axis [1]. LAD, left axis deviation; RAD, right axis deviation.
Axis can be key to diagnosing a variety of arrhythmias. Ventricular tachycardia (VT) will normally show an extreme right (north-west) QRS axis, due to the ectopic focus located in the ventricle. Conversely, a broad complex tachycardia with normal QRS axis may indicate a supraventricular tachycardia (SVT) with aberrant conduction. A newborn with an extreme left QRS axis may have an atrioventricular septal defect (AVSD).
It is also sometimes useful to calculate the P wave axis, which is normally 0 degrees to +90 degrees at all ages [1]. This can be useful to determine the location of the pacemaker and may be abnormal in ectopic atrial tachycardias. In sinus rhythm, the P wave should be upright in lead I and aVF.
P wave
The P wave represents atrial depolarisation that originates from the SA node. As well as diagnosing sinus rhythm, the P wave can be used to detect atrial hypertrophy that impairs the electrical impulse. The best leads to identify the P wave are I, II, V1 and V2.
A tall P wave (amplitude >3mm) indicates right atrial hypertrophy (p-pulmonale). A wide and notched P wave (duration >100ms, or >80ms if younger than 12 months) is a sign of left atrial hypertrophy (p-mitrale) [1]. These may be the first signs of impaired right or left ventricular function.
PR interval
After passing through the atria, the impulse is delayed in the AV node. The time taken for it to pass through the atria and AV node is the PR interval. As young infants have a smaller heart, the PR interval will be shorter, and subsequently increases with age. The PR interval is also shorter with faster heart rates, therefore the normal PR interval can range from 80-200ms.
Diseases that prolong the PR interval (1st degree AV block) include myocarditis, atrial septal defects (ASD) and hyperkalaemia[2]. A short PR interval is classically associated with Wolff-Parkinson-White (WPW) syndrome.
Q wave
The Q wave is the first negative deflection after the P wave, and represents depolarisation of the ventricular septum. Q waves are usually best seen in the lateral (I, V5, V6) and inferior leads (II, III, aVF). Infants and young children may have very deep Q waves, up to 6mm, and this is normal [2].
QRS
The QRS may abnormal in diseases affecting ventricular conduction, most commonly seen as changes in QRS duration or amplitude. The R wave is the first positive deflection of the complex, and may or may not follow a Q wave. The S wave is the downward deflection that follows the R wave. Any additional positive or negative waves are referred to as R’ and S’ waves, respectively.
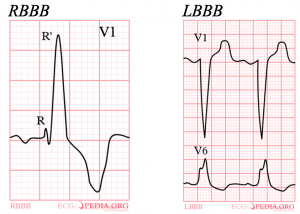
The QRS is abnormally wide if more than 120ms in children or 80ms (2 small squares) in infants [2]. A wide QRS may be caused by arrhythmias of ventricular origin (e.g. VT), bundle branch block (BBB, right or left), or accessory pathways (e.g. WPW syndrome). Right BBB causes an “M” shape (rsR’) in V1 with a tall and wide second peak of the QRS (Figure 4). Left BBB causes a similar pattern but in V6 [2]. WPW syndrome is characterised by a small ‘delta’ wave before the QRS, which can be subtle with only slurring of the R wave. Ventricular arrhythmias can have any shape depending on the ectopic focus, and may look very similar to BBB.

Figure 4: Right and left bundle branch block. Images obtained under Creative Commons licence 3.0 from CardioNetworks ECGpedia.org.
Hypertrophy of the left or right ventricle will also causes QRS changes. In general, a positive R wave in V1 in an older child indicates right ventricular hypertrophy (RVH) [1]. An abnormally tall R wave in V6 usually indicates left ventricular hypertrophy (LVH). Unlike in adults, there is not a universal threshold for diagnosing hypertrophy in children. QRS amplitude changes constantly in childhood and children often have larger complexes than adults. Normal values for age are available, and any concern should prompt specialist referral.
QTc
The duration of the QT interval is often a focus of ECG interpretation and can have serious implications. It is measured from the start of the Q wave (or R wave if there is no Q) to the end of the T wave, not including any U wave. As the QT gets shorter as heart rate increases, it is vital to calculate the corrected QT interval (QTc) in every patient. This is often not accurate on automated ECG analysis. The Bazett formula is shown below [1]:
A QTc more than 450ms is prolonged in all ages, and may increase the risk of arrhythmia and sudden death [3,4]. Causes include genetic long QT syndrome, electrolyte abnormalities and drugs.
T wave and ST segment
Changes in the T wave and ST segment are classically associated with myocardial ischaemia in adults. Thankfully this is rare in paediatrics, however it is still important to understand the normal and abnormal appearances in children. Beyond the first few days of life, T waves are inverted in V1 to V3 and will gradually become upright by adolescence. ST segment elevation is usually due to early repolarisation or “high take-off”, particularly in adolescent boys, and is a normal finding [1].
Pathological ST and T wave changes can be caused by pericarditis or myocarditis. T wave inversion may also result from ventricular strain and severe ventricular hypertrophy [1]. Ischaemia is rare, and usually only seen after cardiac surgery or Kawasaki disease.
Normal ECG changes by age
The age-related changes in the paediatric ECG reflect the normal physiological changes over the first few years of life[2]. Normal ECG patterns for different age ranges can be remembered using the “rule of 3s”:
Birth – 3 days
- Right axis deviation (+90 degrees to +180 degrees)
- Upright T wave in V1 – if persisting beyond day 3 this is a sign of RVH
- Positive QRS complexes in V1 and V2, negative QRS in V5 and V6
Physiology – right ventricular dominance at birth with high pulmonary vascular resistance.
3 days – 3 years
- Right axis deviation (usually normal by 1 month)
- Negative T wave in V1
- Positive QRS complexes in all chest leads (may become isoelectric in V1)
Physiology – pulmonary vascular resistance falls and pressure on the right ventricle reduces. Increasing left ventricular dominance leads to gradual normalisation of the cardiac axis.
3 years – 16 years
- Normal QRS axis (0 degrees to +90 degrees)
- Negative T waves in V1-4 will gradually become upright during childhood
- Negative QRS in V1 and positive (large amplitude) QRS in V5 and V6
Physiology – transition to adult-type pattern with large amplitude QRS reflecting the large heart size relative to chest wall thickness.
Further reading
The systematic approach to ECG interpretation is summarised by Harris et al. (Making sense of the paediatric ECG. Arch Dis Child Educ Pract Ed 2020) [1].
For a more detailed review of ECG interpretation, see How To Read Pediatric ECGs by Park et al [2].
References
| (1) | Harris M, Oakley C, Abumehdi MR. Making sense of the paediatric ECG. Arch Dis Child – Educ Pract Ed 2020;:edpract-2020-319124. doi:10.1136/archdischild-2020-319124 |
| (2) | Park M, Guntheroth W. How To Read Pediatric ECGs. Fourth Edi. Elsevier 2006. |
| (3) | Rijnbeek PR, Witsenburg M, Schrama E, et al. New normal limits for the paediatric electrocardiogram. Eur Heart J 2001;22:702–11. doi:10.1053/euhj.2000.2399 |
| (4) | Trinkley KE, Lee Page R, Lien H, et al. QT interval prolongation and the risk of torsades de pointes: Essentials for clinicians. Curr. Med. Res. Opin. 2013;29:1719–26. doi:10.1185/03007995.2013.840568 |
